In 2026, the leading commercial power plant types are not defined by one universal ranking. Their value depends on local fuel access, grid capacity, financing, water availability, and demand patterns. A plant serving a data center may need steady output, while a utility balancing daytime demand may favor solar paired with storage. The details matter.
Energy expert Amory Lovins, co-founder of the Rocky Mountain Institute, has said, “The cheapest energy is the energy you don’t use.” That principle also applies to plant planning: efficiency can reduce the capacity a project needs to build. It is a useful lens, though it cannot decide every investment.
This overview compares natural-gas combined-cycle plants, nuclear facilities, solar farms, wind projects, hydropower, and emerging battery-supported systems. Gas plants can provide dispatchable power, but fuel costs and emissions remain important considerations. Nuclear plants offer steady generation, yet construction schedules and financing can be challenging. Solar panels work best where sunlight and transmission access align; wind projects depend on consistent wind and suitable sites. Hydropower can deliver flexible output, but geography and environmental conditions limit where it fits. Batteries help shift electricity across hours, though they are not generation plants themselves.
The mix varies. Not every site fits.
Readers should compare reliability, cost, construction time, emissions, and operating needs—not just nameplate capacity. Figures and project outcomes can differ by region, and 2026 market conditions may shift. A practical comparison should make those limits visible, rather than imply that one technology wins everywhere.
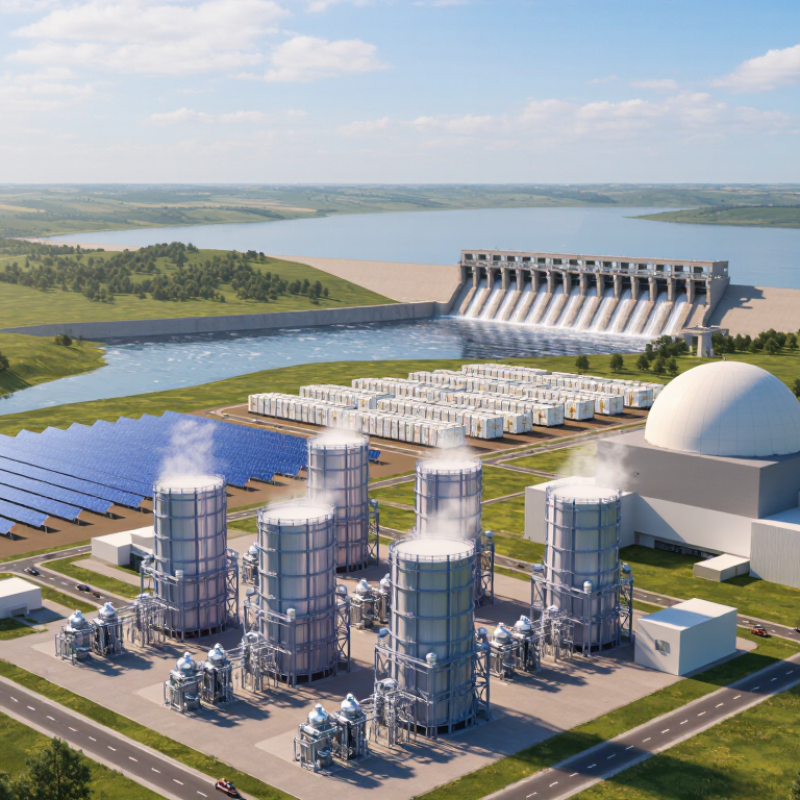
Commercial power plants are commonly classified by their primary energy source and the technology that converts it into electricity. Gas-fired plants burn fuel to drive turbines, while coal plants use heat to produce steam. Nuclear facilities also generate steam, but obtain heat from controlled nuclear reactions. The equipment may look similar from a distance. The process is not.
Renewable plants use different classifications. Solar photovoltaic facilities convert sunlight directly into electricity; solar thermal plants concentrate heat to make steam. Wind farms use turbines driven by moving air, while hydroelectric stations draw on flowing or stored water. Some plants combine technologies, such as solar panels paired with battery storage. These systems complicate simple labels, since storage shifts electricity in time rather than generating it. Classification depends on what the plant actually does.
Operators also describe plants by how quickly they can change output. Dispatchable facilities can generally respond to demand, though ramping speed and fuel availability vary. Wind and solar output depends on weather, so forecasts and storage can influence how they support the grid. There are exceptions. A hydro plant may offer flexible output, but water limits matter during dry periods. For a careful comparison, look at energy source, conversion equipment, storage, and operating role—not just the fuel name on a chart. These categories are useful, but not perfectly tidy.
Thermal plants remain important where power systems need steady output or quick support. The IEA’s Electricity 2024 report estimates that, in 2023, coal supplied about 35% of global electricity, natural gas 23%, nuclear 9%, and bioenergy 2%. These figures describe generation, not plant numbers. Gas units can ramp quickly, depending on their design, making them useful when demand shifts. But flexibility has costs. Gas still emits carbon dioxide, and upstream methane leakage adds climate impact. Coal can deliver sustained power, yet carries high emissions and significant air-pollution burdens.
Nuclear plants generally provide firm, low-carbon electricity, often at high utilization. Their major challenges include long project schedules, financing, and specialized operating requirements. Biomass can use residues such as forestry or agricultural waste, but its climate benefit depends on feedstock, transport, and regrowth. Calling it renewable is not enough. The IEA’s data show its global share remains modest. That trade-off is easy to underestimate when a fuel source sounds inherently clean.
Tips: Compare plants by delivered power, not fuel price alone. Check fuel reliability, cooling-water needs, grid access, and operating flexibility. Ask for lifecycle-emissions assumptions, especially for biomass. A site-specific assessment matters; generic rankings can mislead.
Commercial renewable power plants turn local resources into electricity, but each design solves a different problem. Solar farms use photovoltaic panels to produce power during daylight. Rows of modules can cover dry, open land, while inverters convert their output for the grid. Cloud cover and evening demand create gaps, so batteries or other power sources may be needed. A battery adds cost and has its own operating limits.
Wind plants work best where steady winds meet suitable terrain and grid access. Turbines can generate at night, though output varies with weather and season. Weather still wins. Careful measurement helps developers estimate production, but a forecast can still be wrong.
Hydropower uses flowing or stored water to drive turbines. Reservoir plants can adjust output relatively quickly, which helps balance changing demand. Yet water levels, drought, fish movement, and river conditions shape what a site can reliably provide.
Geothermal plants draw heat from underground to produce steady electricity, often with a smaller land footprint than large solar or wind projects. Drilling is expensive, and underground resources are not equally accessible everywhere. For a commercial project, the practical choice depends on resource data, connection costs, local demand, and environmental monitoring. The cleanest-looking plan on paper may need revision once actual site conditions appear.
Commercial power plants in 2026 differ in more than nameplate capacity. Natural-gas plants can ramp output quickly when evening demand rises or solar production falls. They rely on fuel deliveries and emit carbon during operation. Fast, but not impact-free.
Utility-scale solar and wind avoid fuel combustion, but their output changes with sunlight and weather. A solar array may produce strongly at midday, then contribute little after sunset. Wind farms can generate at night, though local wind patterns matter. Storage and transmission can help balance these swings, but add cost and planning needs. A neat ranking can mislead.
Hydropower can provide flexible generation where water resources and suitable sites exist, while drought can constrain output. Nuclear plants deliver steady, low-carbon electricity, but projects typically require substantial investment and long construction timelines. Geothermal offers consistent power in suitable locations, though accessible resources are unevenly distributed. The better fit depends on local demand, grid connections, water availability, fuel access, and the need for flexible output. There is no perfect match. Even a technically strong option may be less practical when a region lacks transmission capacity or dependable water.
| Power plant type | Typical capacity factor | Dispatchability | Direct operating emissions | Common commercial role | Key constraint |
|---|---|---|---|---|---|
| Nuclear | About 85–95% | High; generally provides steady output, with flexibility depending on plant design and operating practice. | Very low direct carbon dioxide emissions during generation. | Reliable, continuous low-carbon electricity. | High upfront cost, long development timelines, and demanding safety and waste-management requirements. |
| Coal | About 40–70% | Moderate to high; output can be adjusted, but starts and ramping are generally slower than gas plants. | High carbon dioxide emissions; air-pollutant controls are also required. | Dispatchable bulk power in markets where plants remain in service. | High emissions, fuel and compliance costs, and exposure to retirement or policy risk. |
| Natural gas combined cycle | About 40–70% | High; can provide steady generation and respond to changing demand. | Emits carbon dioxide; typically less per unit of electricity than coal, but more than near-zero-carbon sources. | Flexible bulk generation and support for variable renewable output. | Fuel-price volatility, fuel-supply needs, and direct emissions. |
| Natural gas simple-cycle | About 5–20% | Very high; commonly designed for fast starts and peak-demand response. | Emits carbon dioxide; generally less efficient per unit of electricity than combined-cycle gas generation. | Peaking capacity, reserves, and short-duration balancing. | Low utilization can make economics dependent on peak prices and capacity payments. |
| Hydropower | About 30–60% | High for reservoir plants; run-of-river output is more dependent on water flows. | No fuel-combustion emissions at the plant; reservoir emissions can vary by site. | Dispatchable generation, grid balancing, and—in some facilities—energy storage. | Suitable sites are limited; output can be affected by drought, water use, and ecological constraints. |
| Geothermal | About 70–90% | Generally high; output can provide steady generation, subject to resource and plant conditions. | Usually low, but direct emissions vary with the geothermal resource and control system. | Steady generation where suitable underground heat resources are available. | Resource exploration and drilling risk, plus strong dependence on local geology. |
| Utility-scale solar photovoltaic | About 20–30% | Weather- and daylight-dependent; output can be forecast but is not fully dispatchable without storage. | No direct emissions during electricity generation. | Daytime energy supply, often paired with storage or other flexible resources. | Variable output, land and interconnection needs, and reduced generation after sunset. |
| Onshore wind | About 30–45% | Weather-dependent; output can be forecast but is not fully dispatchable. | No direct emissions during electricity generation. | Low-carbon bulk energy in areas with strong wind resources. | Variable output, transmission requirements, and dependence on suitable wind sites. |
Note: Capacity-factor ranges are broad, indicative values rather than guarantees. Actual results vary with plant design, location, resource quality, maintenance, operating strategy, and market conditions. Capacity factor is actual electricity generated over a period divided by the amount that would have been generated if the plant operated at full capacity throughout that period.
Selecting a commercial power plant begins with the site’s actual demand. Start with the load, not the machinery. A food-processing facility may need steady power for refrigeration, while a warehouse may have sharp morning and evening peaks. Review hourly consumption data, seasonal changes, and planned expansion. Short peaks matter. This helps size equipment without paying for capacity that sits unused.
Fuel access and local conditions can reshape the shortlist. A gas-fired plant may offer dispatchable power, but dependable fuel supply and emissions controls affect operating costs. Solar generation can reduce daytime grid use, yet output changes with weather and daylight. Storage may help, but adds equipment and maintenance needs. Water availability, noise limits, available land, and grid connection capacity deserve early checks. There is no free option.
Compare lifetime costs, not just the purchase price. Include fuel, staffing, routine servicing, replacement parts, insurance, and expected downtime. Ask how quickly critical components can be repaired, and whether technicians are available nearby. A spreadsheet can hide this. I would treat projected savings cautiously when fuel prices, demand, or construction schedules remain uncertain. Site teams should test several demand scenarios before choosing a plant configuration.
As a specialist in environmental and flow sensor technology, ScioSense enables companies to use the planet’s resources more sustainably, helping to create a healthier future for all.